itemplot
# ItemResponsePlots.itemplot — Function.
julia
itemplot(model, item, args...; kwargs...)Create an item plot for item of model.
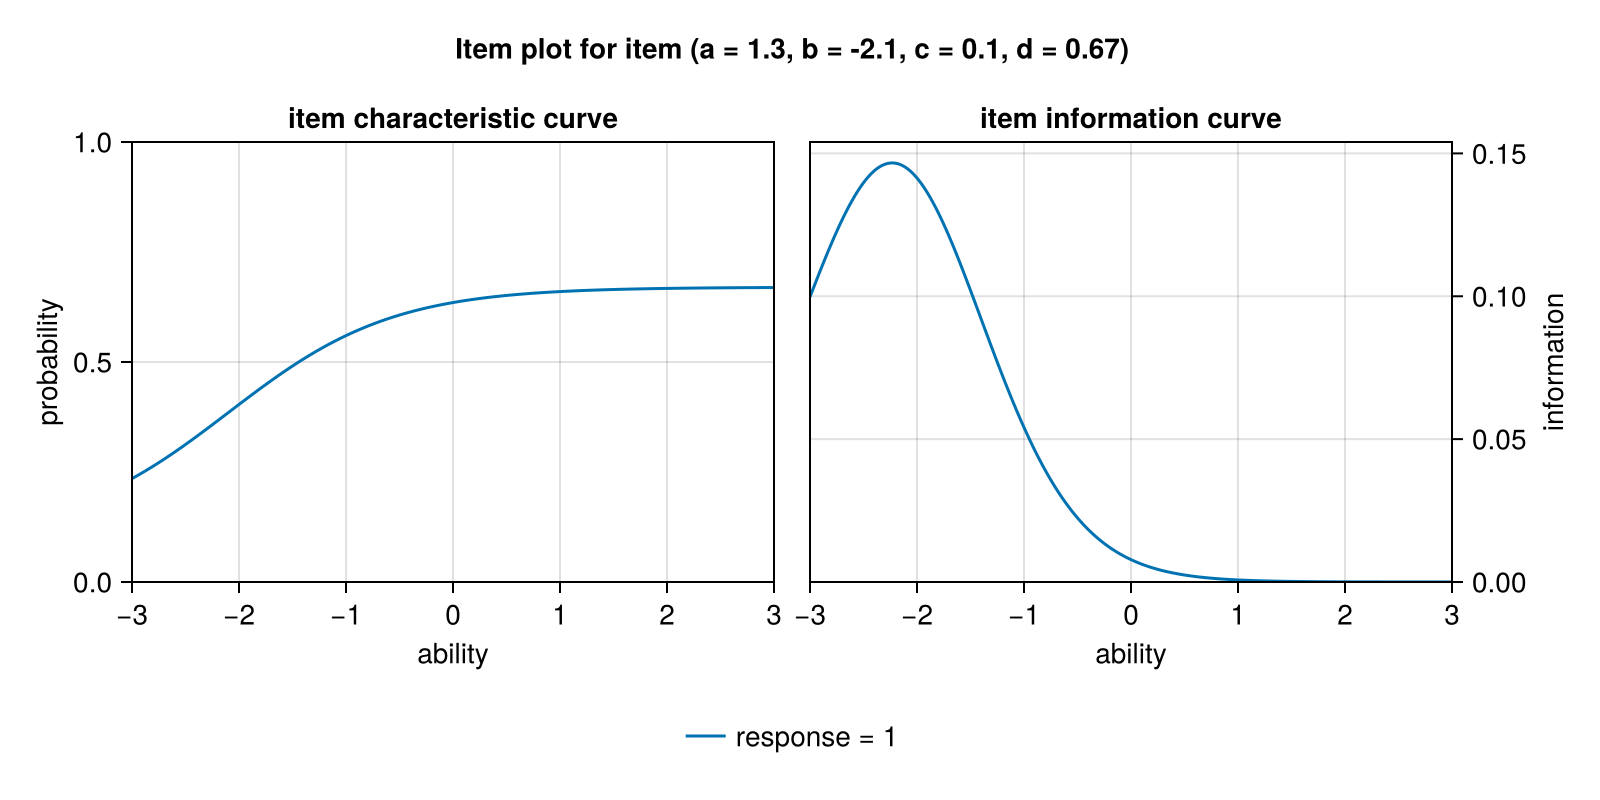
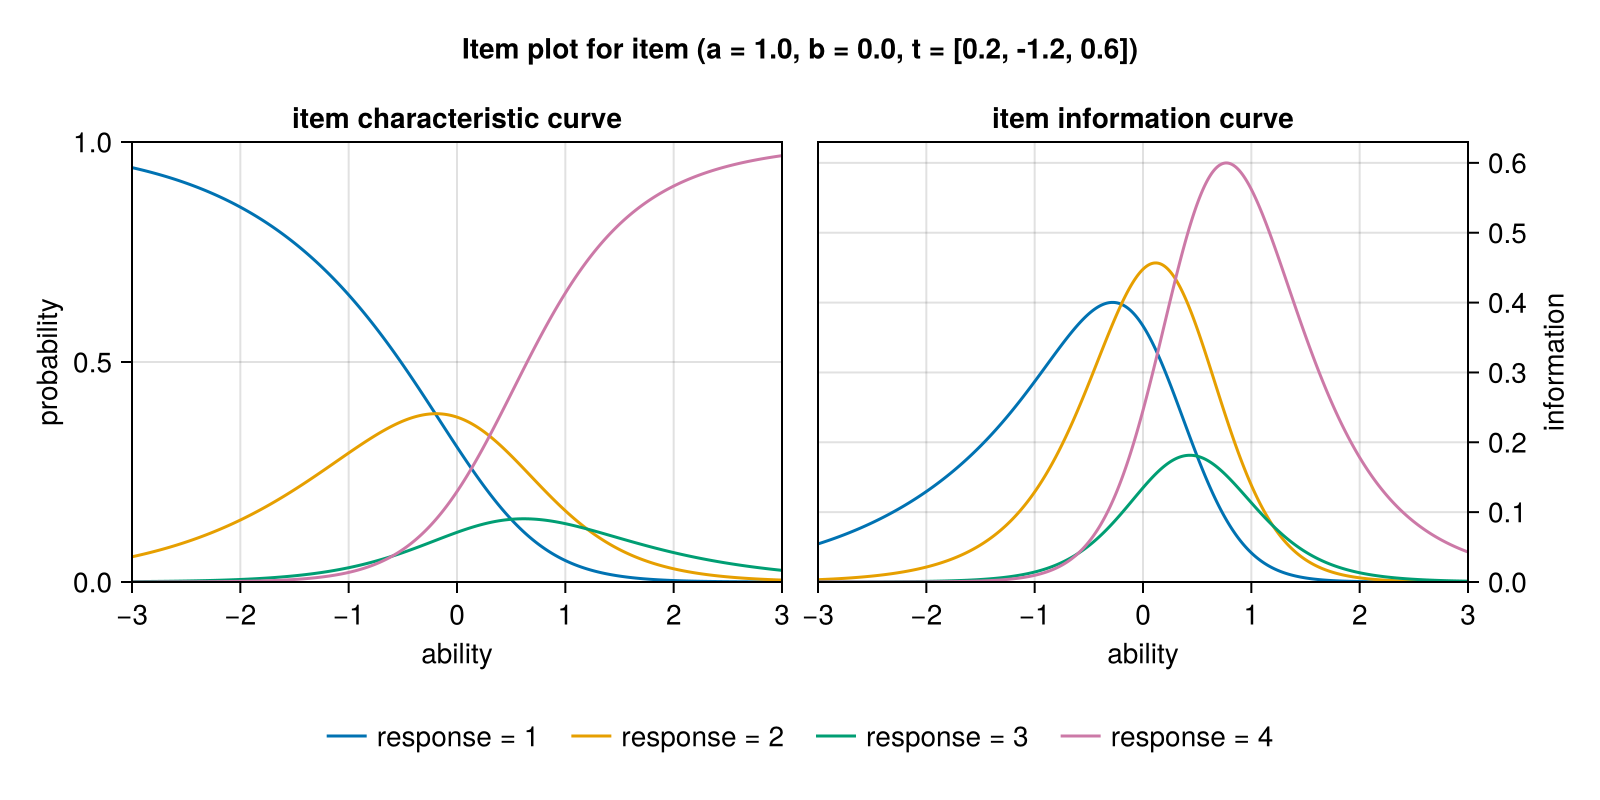
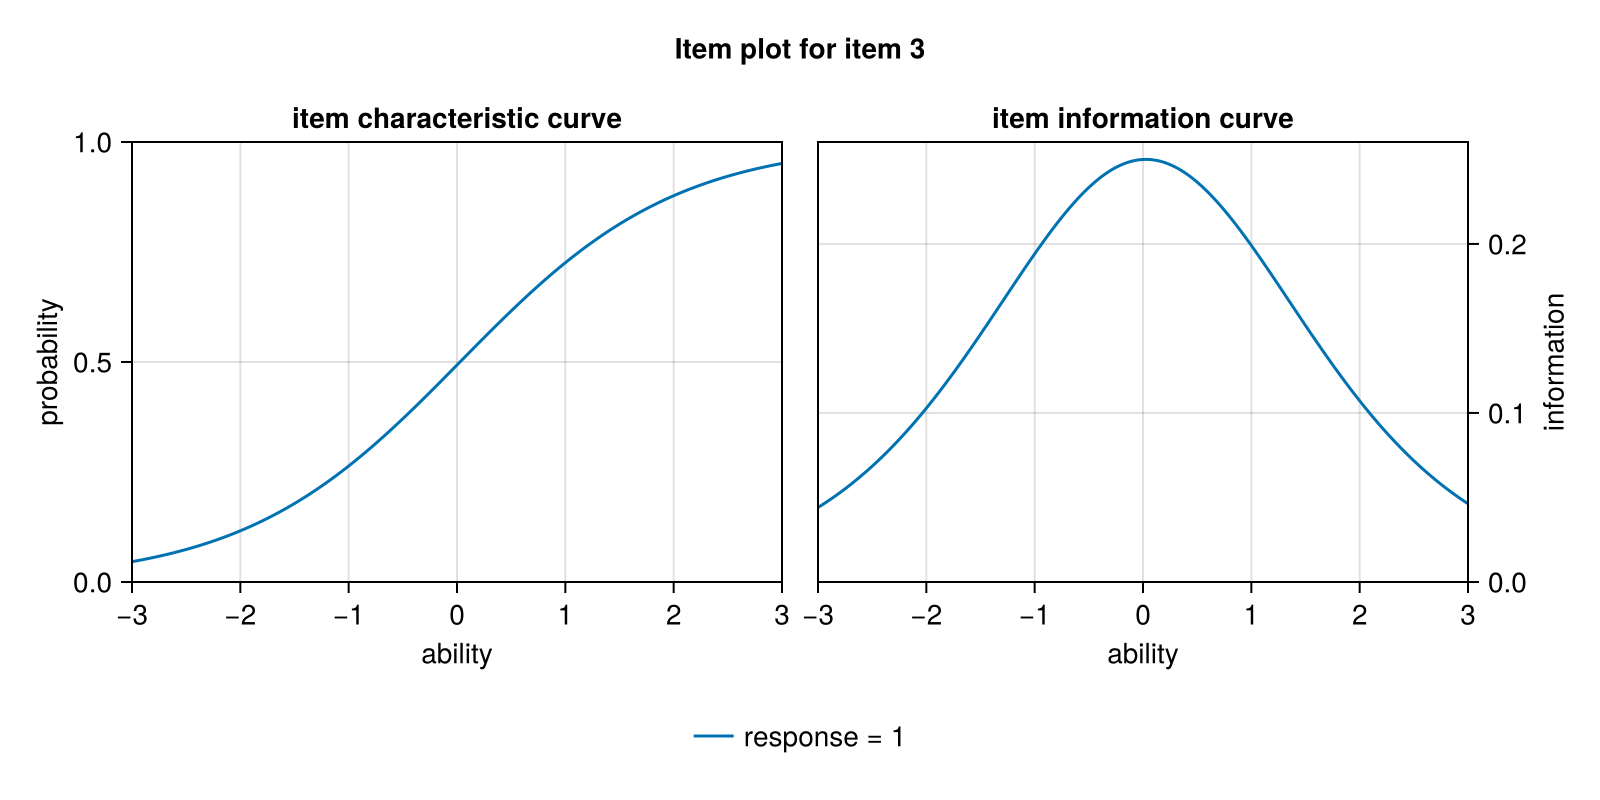
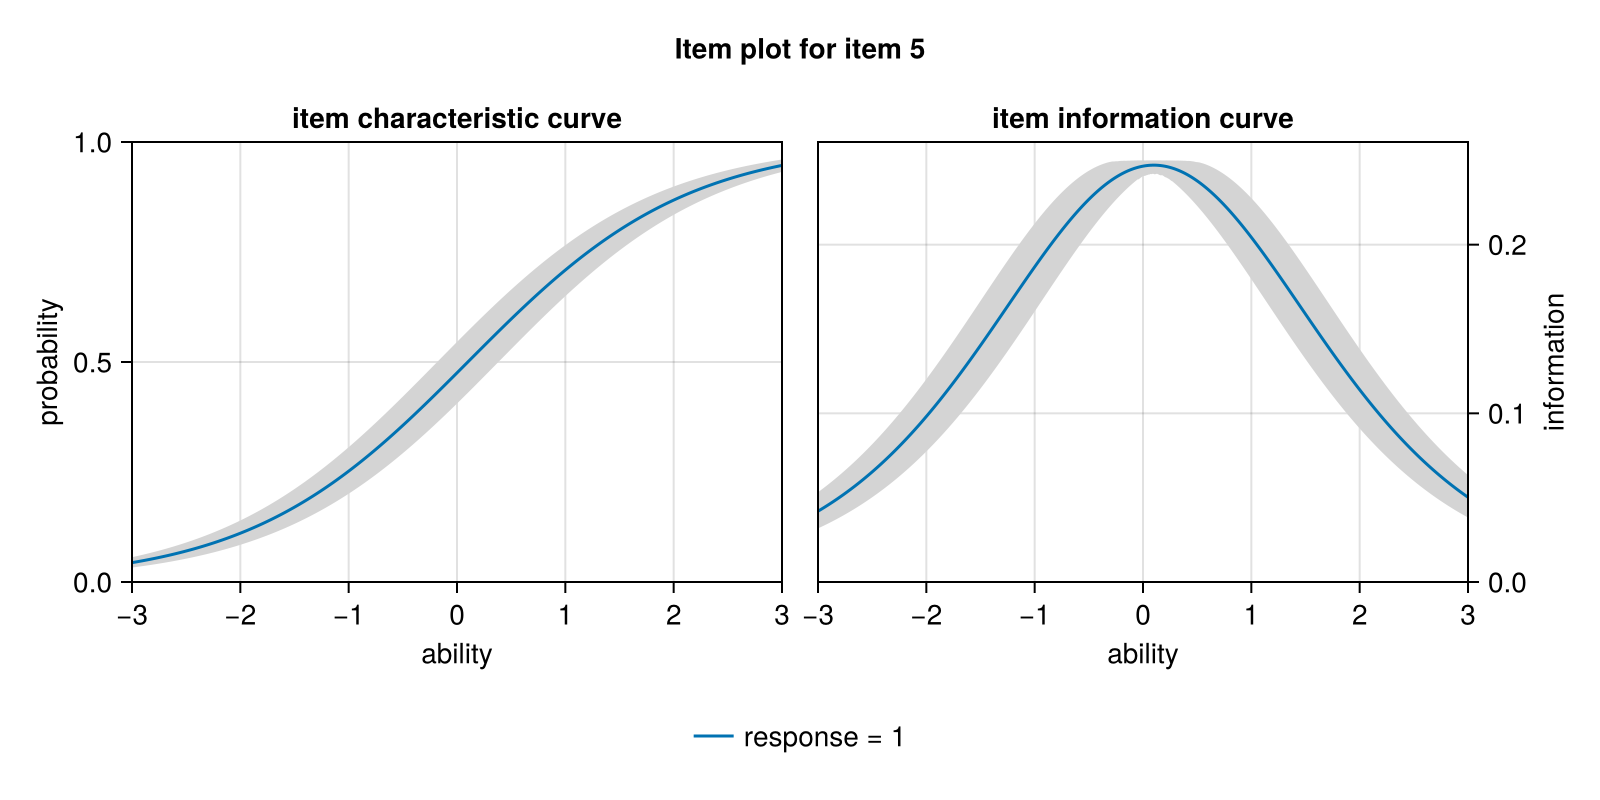
The resulting item plot contains the item characteristic curve (left) and the item information curve (right).
The additional args... and kwargs... are passed to the lower level functions item_characteristic_curve and item_information_curve.
From ItemResponseFunctions.jl
julia
using CairoMakie
using ItemResponsePlots
using ItemResponseFunctions

item = (a = 1.3, b = -2.1, c = 0.1, d = 0.67)

itemplot(FourPL, item)
julia
using CairoMakie
using ItemResponsePlots
using ItemResponseFunctions

thresholds = [0.2, -1.2, 0.6]
item = (a = 1.0, b = 0.0, t = thresholds)

itemplot(GRSM, item)
From RaschModels.jl
Frequentist Estimation
julia
using CairoMakie
using RaschModels
using ItemResponsePlots

responses = rand(0:1, 100, 6)
model = fit(RaschModel, responses, CML())

itemplot(model, 3)
Bayesian Estimation
julia
using CairoMakie
using RaschModels
using ItemResponsePlots

responses = rand(0:1, 100, 6)
model = fit(RaschModel, responses, NUTS(), 500, progress = false)

itemplot(model, 5, 1, uncertainty_type = :interval)
┌ Info: Found initial step size
└ ϵ = 0.8