Getting started
After successful installation you can start plotting your item response models. Typically visualizations of item response models are made from models fitted to data. In this simple example we will fit a Rasch Model to simulated data and plot the results.
Fitting the model
Using the RaschModels.jl package we can fit a simple Rasch Model to dichotomous responses from 100 persons to 5 items.
using RaschModels

n_persons = 100
n_items = 5

data = rand(0:1, n_persons, n_items)
model = fit(RaschModel, data, CML())
RaschModels.RaschModel{AbstractItemResponseModels.PointEstimate, Matrix{Int64}, RaschModels.CombinedCMLResult{NamedArrays.NamedVector{Float64, Vector{Float64}, Tuple{OrderedCollections.OrderedDict{Symbol, Int64}}}}}([1 1 … 1 1; 0 0 … 1 0; … ; 1 0 … 0 1; 1 0 … 1 1], RaschModels.CombinedCMLResult{NamedArrays.NamedVector{Float64, Vector{Float64}, Tuple{OrderedCollections.OrderedDict{Symbol, Int64}}}}(RaschModels.RaschModel, [0.017024428352728695, 0.13694164564974673, -0.3878068258333272, 0.13694164564973482, 0.09689910618111697, 1.1117632613014234, -0.339639326645471, 0.3419671477622848, -0.339639326645471, -0.339639326645471 … -1.1115592941177808, -1.1115592941177808, 0.3419671477622848, 1.1117632613014234, -1.1115592941177808, -0.339639326645471, -0.339639326645471, 0.3419671477622848, -0.339639326645471, 1.1117632613014234], RaschModels.CMLResult{NamedArrays.NamedVector{Float64, Vector{Float64}, Tuple{OrderedCollections.OrderedDict{Symbol, Int64}}}, Optim.MultivariateOptimizationResults{Optim.BFGS{LineSearches.InitialStatic{Float64}, LineSearches.HagerZhang{Float64, Base.RefValue{Bool}}, Nothing, Nothing, Optim.Flat}, Vector{Float64}, Float64, Float64, Vector{Optim.OptimizationState{Float64, Optim.BFGS{LineSearches.InitialStatic{Float64}, LineSearches.HagerZhang{Float64, Base.RefValue{Bool}}, Nothing, Nothing, Optim.Flat}}}, Bool, @NamedTuple{f_limit_reached::Bool, g_limit_reached::Bool, h_limit_reached::Bool, time_limit::Bool, callback::Bool, f_increased::Bool}}}(RaschModels.RaschModel, [0.017024428352728695, 0.13694164564974673, -0.3878068258333272, 0.13694164564973482, 0.09689910618111697], * Status: success
* Candidate solution
Final objective value: 1.923017e+02
* Found with
Algorithm: BFGS
* Convergence measures
|x - x'| = 6.25e-07 ≰ 0.0e+00
|x - x'|/|x'| = 1.54e-06 ≰ 0.0e+00
|f(x) - f(x')| = 7.79e-12 ≰ 0.0e+00
|f(x) - f(x')|/|f(x')| = 4.05e-14 ≰ 0.0e+00
|g(x)| = 6.19e-13 ≤ 1.0e-08
* Work counters
Seconds run: 0 (vs limit Inf)
Iterations: 4
f(x) calls: 9
∇f(x) calls: 9
, -192.3017023549582, 4, RaschModels.ESF{Float64}([1.0, 5.196269283817165, 10.664095692105557, 10.828722831882228, 5.449746476236274, 1.0888500526424376], [1.0 0.8869938614273449 … 0.8869938614273555 0.9232320405811877; 4.196269283817165 3.8223008468595 … 3.822300846859535 3.9450048935521638; … ; 1.0888500526424376 1.0888500526424374 … 1.0888500526424376 1.0888500526424376; 0.0 0.0 … 0.0 0.0], [1.0 0.0 … 0.0 0.0; 4.196269283817165 0.8869938614273449 … 0.8869938614273555 0.9232320405811877; … ; 1.0888500526424376 1.0888500526424374 … 1.0888500526424376 1.0888500526424376; 0.0 0.0 … 0.0 0.0;;; 0.0 0.8869938614273449 … 0.0 0.0; 0.8869938614273449 3.8223008468595 … 0.7867581102098014 0.8189011526685549; … ; 1.0888500526424374 1.0888500526424374 … 1.0888500526424374 1.0888500526424374; 0.0 0.0 … 0.0 0.0;;; 0.0 0.0 … 0.0 0.0; 1.4990495203812773 1.3296477225537986 … 1.3296477225538144 1.3839705476338573; … ; 1.0888500526424376 1.0888500526424376 … 1.0888500526424374 1.0888500526424374; 0.0 0.0 … 0.0 0.0;;; 0.0 0.0 … 0.8869938614273555 0.0; 0.8869938614273555 0.7867581102098014 … 3.822300846859535 0.8189011526685647; … ; 1.0888500526424376 1.0888500526424374 … 1.0888500526424376 1.0888500526424376; 0.0 0.0 … 0.0 0.0;;; 0.0 0.0 … 0.0 0.9232320405811877; 0.9232320405811877 0.8189011526685549 … 0.8189011526685647 3.9450048935521638; … ; 1.0888500526424376 1.0888500526424374 … 1.0888500526424376 1.0888500526424376; 0.0 0.0 … 0.0 0.0], 5, 6), [0.0320155531211813 -0.007925919840035755 … -0.007925919840035751 -0.007905613645230044; -0.007925919840035756 0.032141112604058476 … -0.007952000207625607 -0.007937463707714839; … ; -0.00792591984003575 -0.007952000207625603 … 0.032141112604058455 -0.007937463707714839; -0.00790561364523004 -0.007937463707714844 … -0.007937463707714837 0.032076154090445536], RaschModels.CML{RaschModels.SummationAlgorithm}(RaschModels.SummationAlgorithm(), nothing, true)), RaschModels.PersonParameterResult{RaschModels.PersonParameterWLE}(RaschModels.RaschModel, [-2.4218164031736573, -1.1115592941177808, -0.339639326645471, 0.3419671477622848, 1.1117632613014234, 2.4178195649144976], [1.6254896121386986, 1.0379652932148578, 0.9116645322564976, 0.9113375984955893, 1.036904963165731, 1.6230039220480008], RaschModels.PersonParameterWLE())), [Symbol("beta[1]"), Symbol("beta[2]"), Symbol("beta[3]"), Symbol("beta[4]"), Symbol("beta[5]")])Plotting results
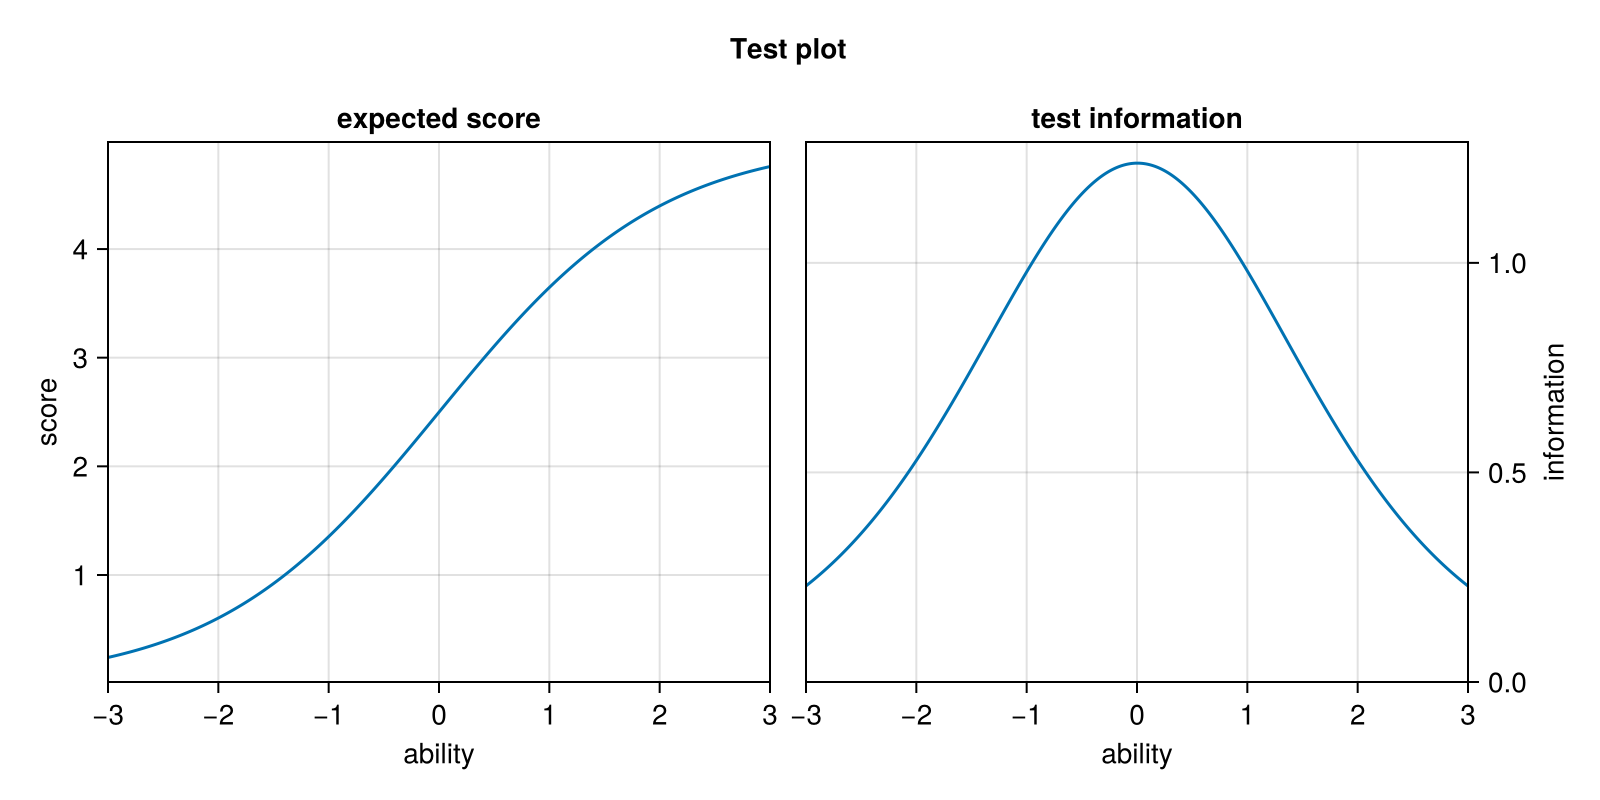
Having fit the model we can now plot the results. In this example we create a plot for the whole test (5 items) by calling the testplot function.
testplot only requires the fitted model (model) as the single function argument.
using CairoMakie
using ItemResponsePlots

testplot(model)
The plot above contains the test characteristic curve on the left and the test information curve on the right.
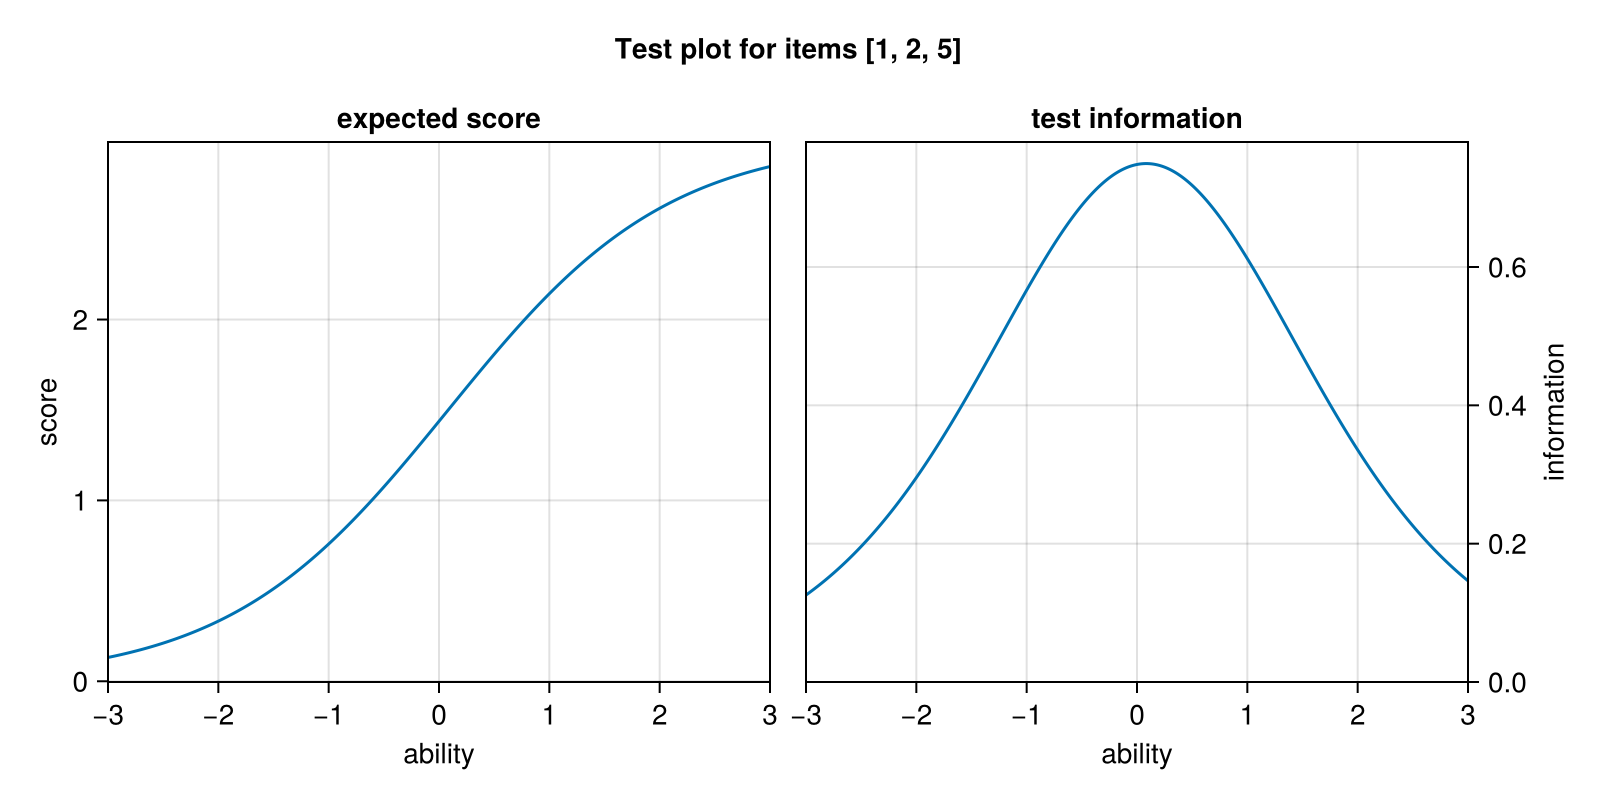
If we are interested in only a subset of items, we can plot this subset by passing a set of indices to testplot in the second argument.
items = [1, 2, 5]
testplot(model, items)
How to continue from here?
If you are interested in ways to expand on the example above, you can take a look at the function reference for testplot and its building blocks expected_score_plot and information_plot.
If you want to see more examples of item response plots, consider the Examples page of this documentation.