testplot
# ItemResponsePlots.testplot — Function.
julia
testplot(model, args...; kwargs...)Create a plot for test characteristics of model.
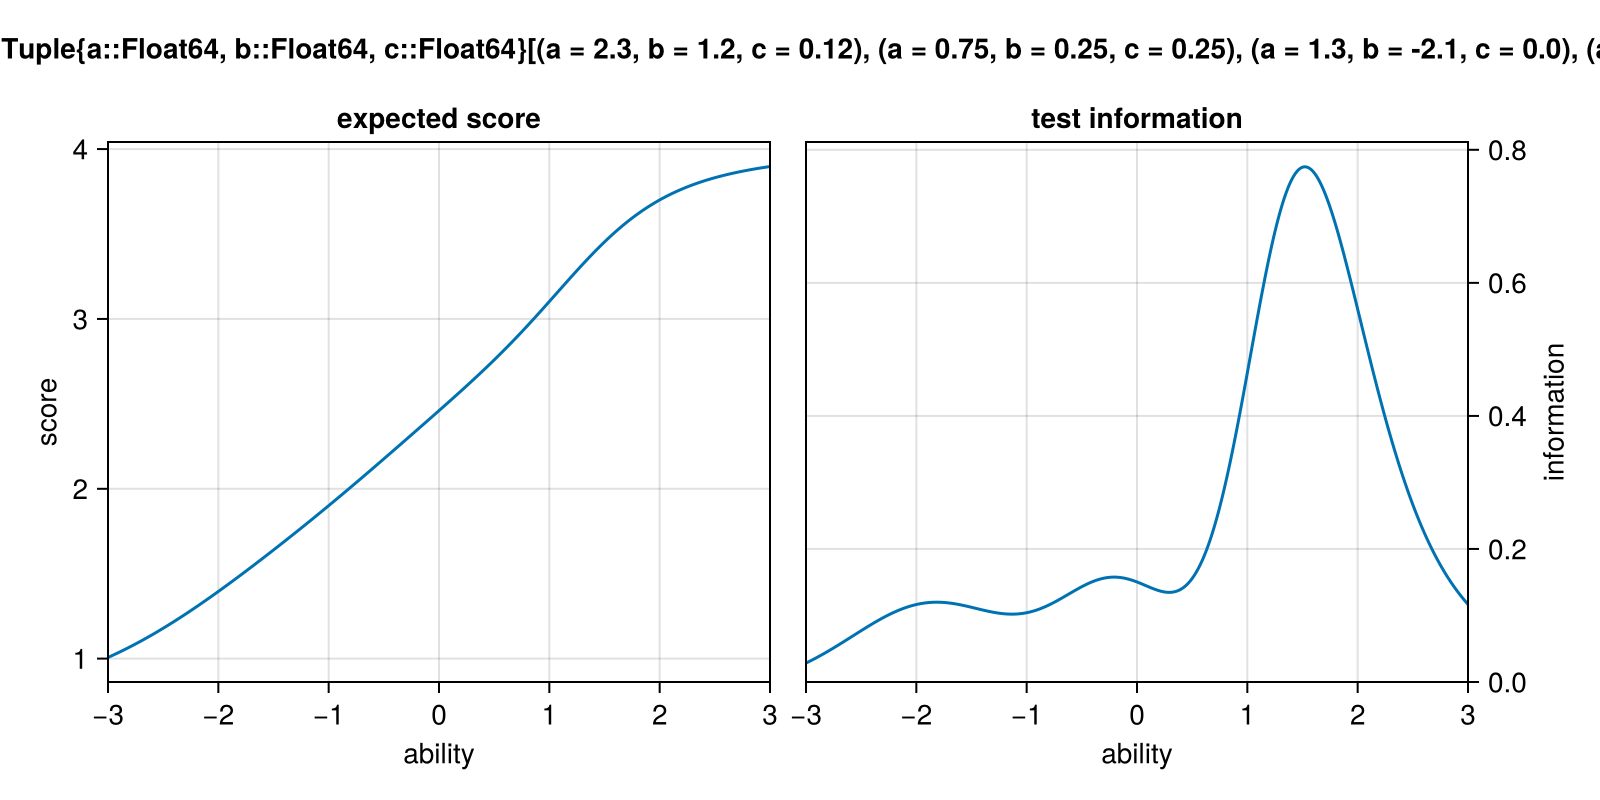
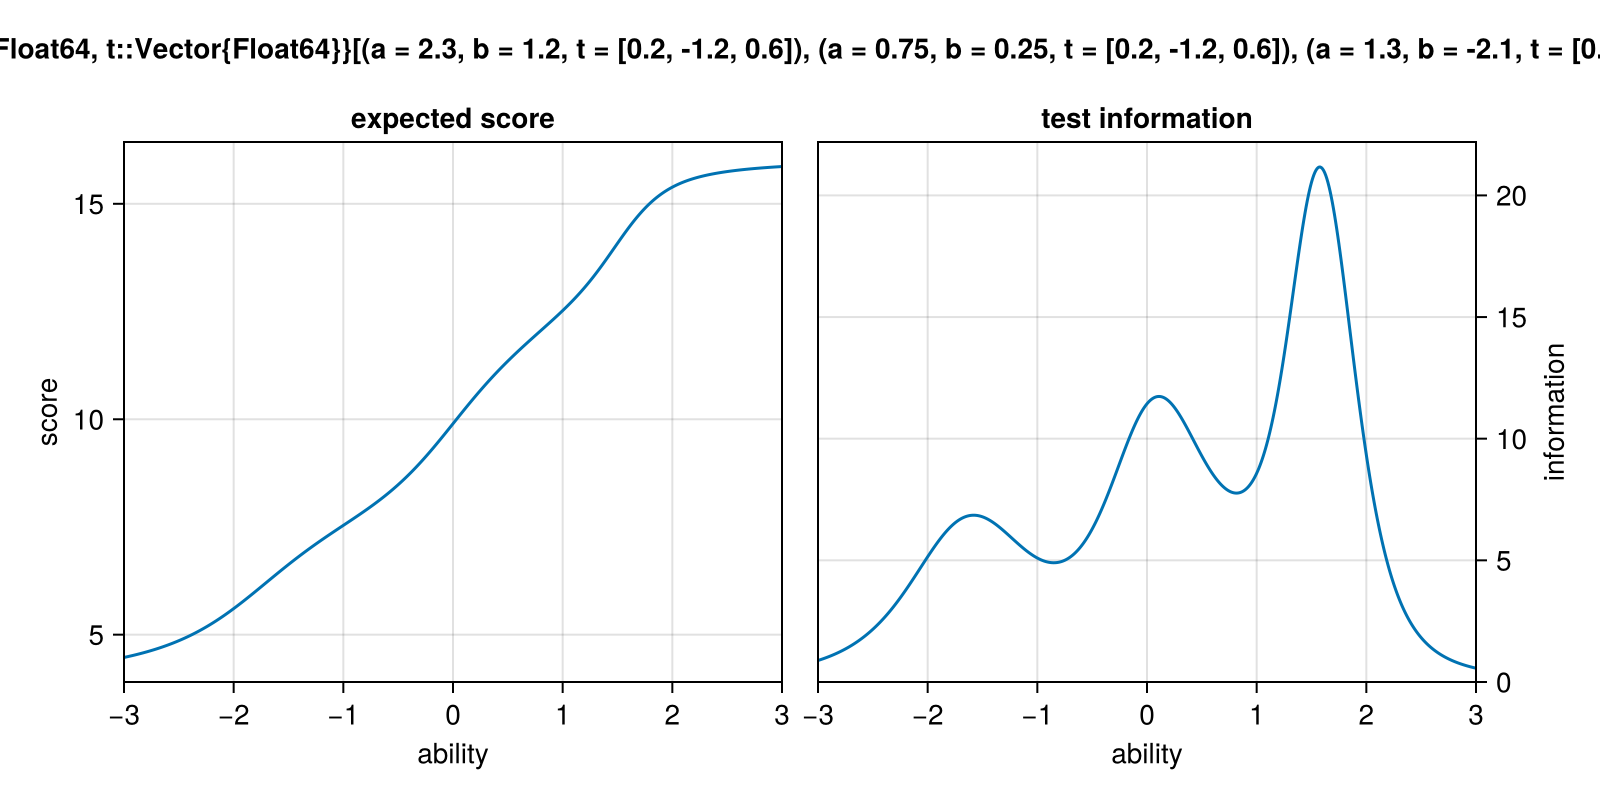
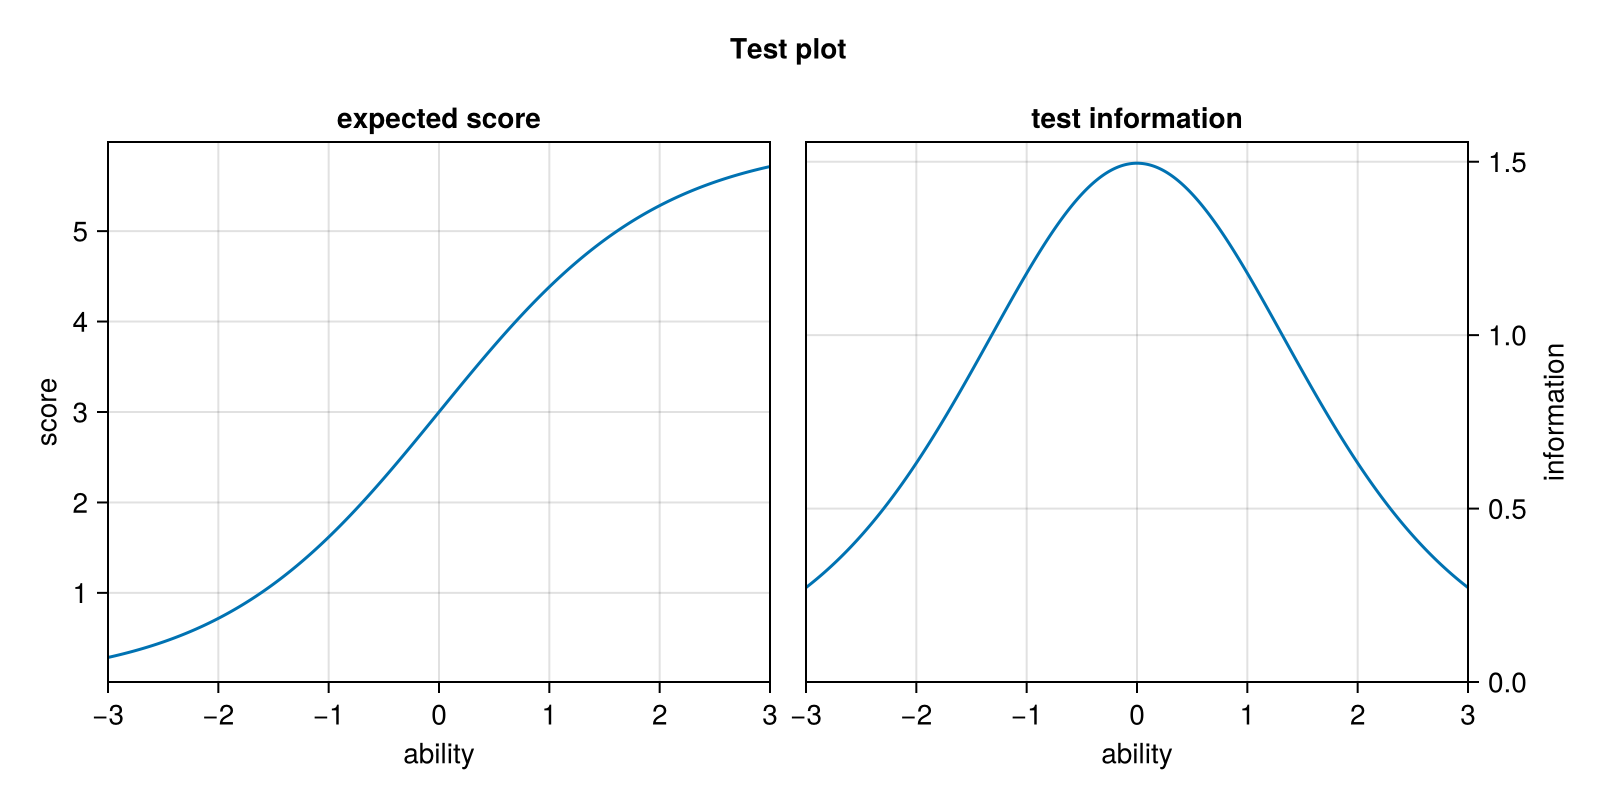
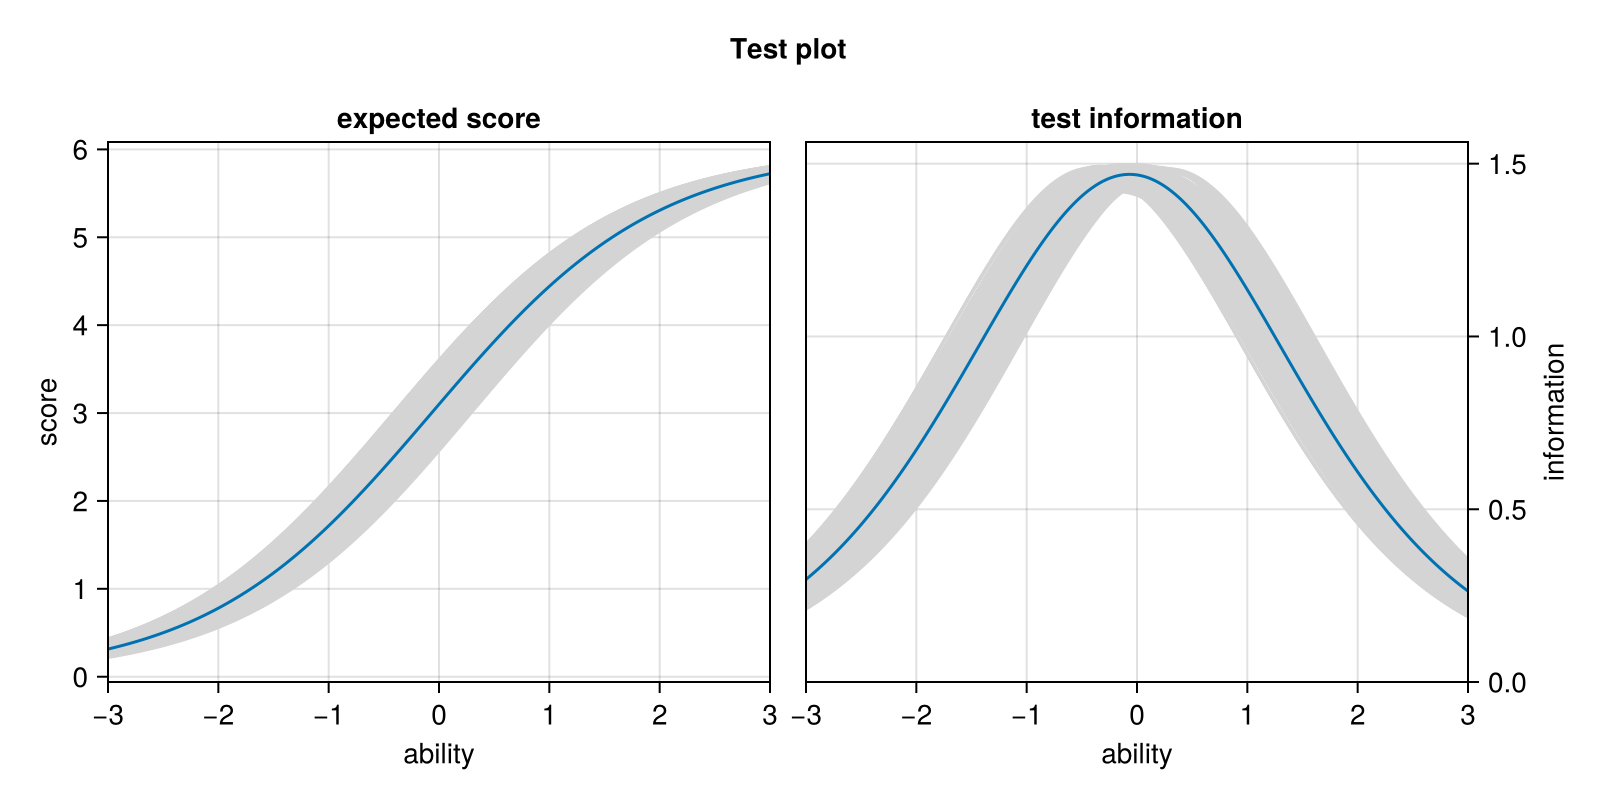
The resulting plot contains the test characteristic curve/expected scores (left) and the test information curve (right).
The additional args... and kwargs... are passed to the lower level plotting functions expected_score_plot and information_plot.
From ItemResponseFunctions.jl
julia
using CairoMakie
using ItemResponsePlots
using ItemResponseFunctions

items = [
    (a = 2.3, b = 1.2, c = 0.12),
    (a = 0.75, b = 0.25, c = 0.25),
    (a = 1.3, b = -2.1, c = 0.0),
    (a = 1.6, b = -0.36, c = 0.33),
]

testplot(ThreePL, items)
julia
using CairoMakie
using ItemResponsePlots
using ItemResponseFunctions

thresholds = [0.2, -1.2, 0.6]
items = [
    (a = 2.3, b = 1.2, t = thresholds),
    (a = 0.75, b = 0.25, t = thresholds),
    (a = 1.3, b = -2.1, t = thresholds),
    (a = 1.6, b = -0.36, t = thresholds),
]

testplot(GRSM, items)
From RaschModels.jl
Frequentist Estimation
julia
using CairoMakie
using RaschModels
using ItemResponsePlots

responses = rand(0:1, 100, 6)
model = fit(RaschModel, responses, CML())

testplot(model)
Bayesian Estimation
julia
using CairoMakie
using RaschModels
using ItemResponsePlots

responses = rand(0:1, 100, 6)
model = fit(RaschModel, responses, NUTS(), 500, progress = false)

testplot(model)
┌ Info: Found initial step size
└ ϵ = 0.8