expected_score_plot
expected_score_plot(model)
expected_score_plot(model, items)
Create a plot of the expected score for model.
If items is specified, the expected score is plotted according to the subtest including only items. If items is omitted, the expected score is plotted for all items included in model.
Plot attributes
Generic
color: The color of the expected score plot.uncertainty_color: The color of the displayed uncertainty information. For plots with uncertainty intervals this is the color of the confidence band. For plots with sample based uncertainty information this is the line color of the samples.theta: The values ofthetafor which to plot the expected scores. default: -3.0:0.01:3.0.scoring_function: The scoring function applied to the expected scores.
Specific
Models with SamplingEstimate
samples: The number of samples to plot. default: 1000.uncertainty_type: Changes how the uncertainty of the estimate is displayed. Ifuncertainty_type = :samples, then iterations from the MCMC estimation are plotted. Ifunvertainty_type = :interval, then uncertainty intervals are plotted. default::samplesquantiles: The lower and upper quantile for uncertainty intervals. default:(0.1, 0.9)aggregate_fun: A function that aggregates MCMC samples. The provided function must take a vector as input and output a scalar value. Ifaggregate_fun = nothingno aggregate is plotted. default: mean
From ItemResponseFunctions.jl
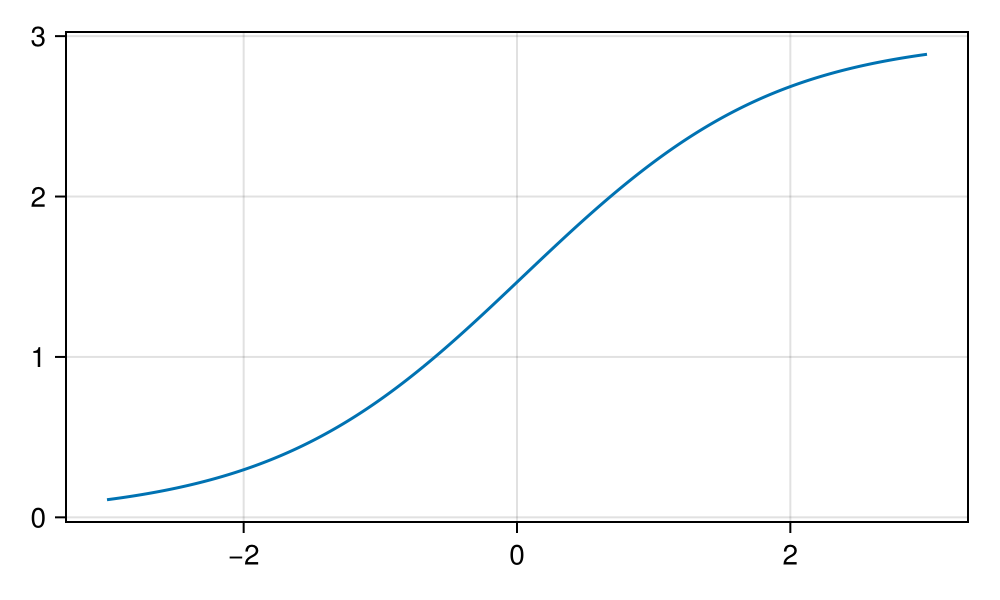
Dichotomous items
using CairoMakie
using ItemResponsePlots
using ItemResponseFunctions

items = [
    (a = 0.3, b = 0.0),
    (a = 2.1, b = 1.3),
    (a = 1.0, b = -0.8),
    (a = 1.2, b = -1.5)
]

expected_score_plot(TwoPL, items)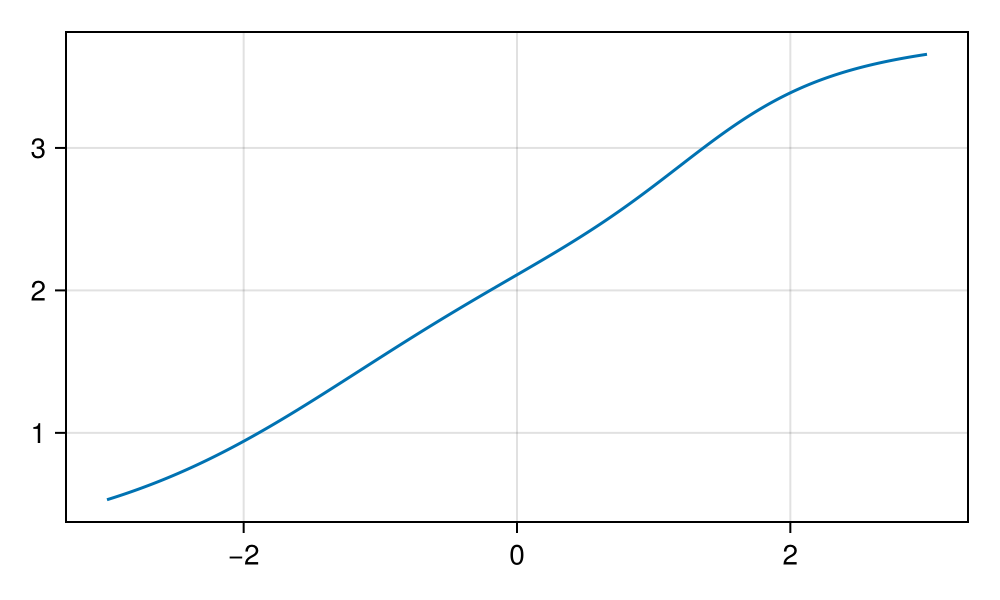
Polytomous items
using CairoMakie
using ItemResponsePlots
using ItemResponseFunctions

items = [
    (a = 1.2, b = 0.0, t = randn(3)),
    (a = 2.1, b = 0.0, t = randn(4)),
    (a = 0.6, b = 0.0, t = randn(2))
]

expected_score_plot(GPCM, items)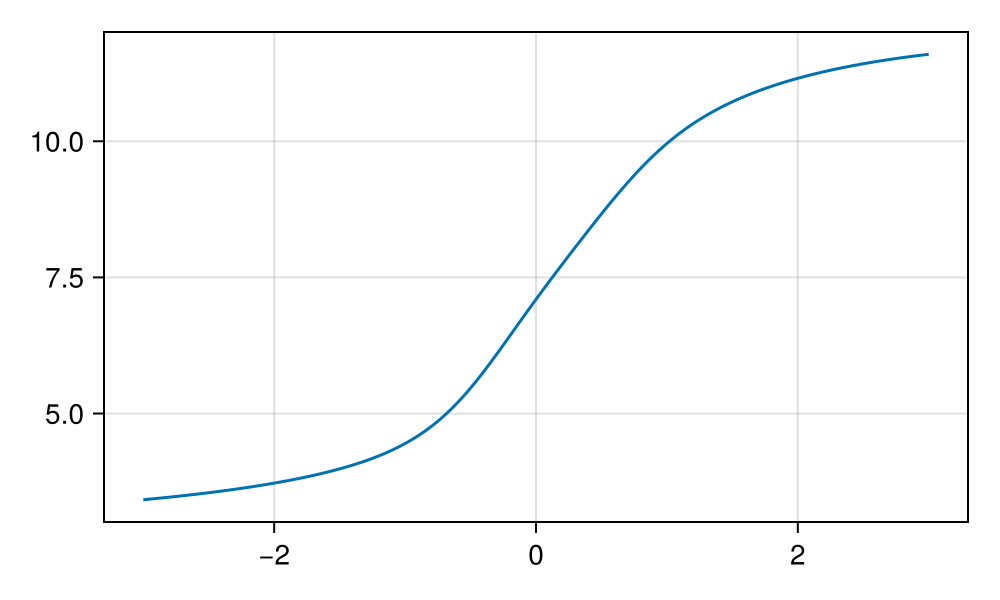
using CairoMakie
using ItemResponsePlots
using ItemResponseFunctions

items = [
    (b = 0.0, t = randn(2)),
    (b = 0.0, t = randn(2)),
    (b = 0.0, t = randn(2))
]

expected_score_plot(RSM, items; scoring_function = partial_credit(3))